For this statistic class, we are asked to work with R, not Excel. So I have to download the software in my computer.
You can download the free software here https://cran.r-project.org/bin/windows/base/
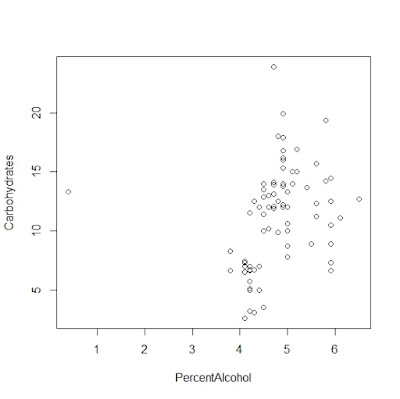
Scatterplot using R
data1=read.csv("beer.csv")
attach(data1)
plot(PercentAlcohol,Carbohydrates)
To make the Regression Line
data1=read.csv("beer.csv")
attach(data1)
plot(PercentAlcohol,Carbohydrates,
main= "Scatterplot of Carbohydrates Versus Percent Alcohol")
x= PercentAlcohol
z= Calories
y= Carbohydrates
r=cor (Carbohydrates,
PercentAlcohol)
sc= sd ( Carbohydrates)
sp= sd ( PercentAlcohol)
b1= r* (sc/sp)
b0= mean(y)-b1*mean(x)
abline(b0,b1,col=2)
See the differences of these two scatterplots


Tidak ada komentar:
Posting Komentar